Blog & Design Guide

On this page
PCB copper thickness appears in drawings as an area weight, a nominal thickness, or a finished-copper requirement. Those labels describe related quantities, but they do not always refer to the same point in the board process. A calculation that treats "1 oz copper" as a measured finished trace can miss foil reduction, outer-layer plating, and the sloped sides left by etching.
The steps below convert area weight to microns, then use conductor geometry to estimate direct-current (DC) resistance, voltage drop, and I²R loss. The material calculation stays separate from the finished trace shape. That distinction helps when you compare a nominal layer callout with a measured cross-section or trace width.
In the conventional PCB notation, copper weight is an area mass: ounces of copper per square foot. One ounce per square foot is 28.3495 grams distributed across 0.09290304 square metres. If the copper is treated as a uniform sheet, its thickness is the mass per unit area divided by density.
t = m / (ρ × A)
For standard annealed copper, the NIST copper-wire tables list a 20 °C density of 8.89 g/cm³. Using that reference value, one ounce per square foot converts to 34.325 μm. The common "35 μm" designation rounds this result. It is a nominal label, not a guarantee that every point on a finished trace measures exactly 35 μm. NIST also gives the reference resistivity and resistance temperature coefficient used below. IEC 60028 describes the international resistance standard for copper and the basis for expressing commercial annealed copper conductivity relative to that reference. NIST Copper Wire Tables; IEC 60028.
At this density, the same calculation gives 17.163 μm for 0.5 oz/ft² and 68.651 μm for 2 oz/ft². The values scale linearly with area weight because the assumed density stays fixed. If a material specification uses a different copper grade, density convention, foil type, or supplier tolerance, use the document that controls that procurement instead of silently substituting a preferred conversion chart.
The bar chart below applies one set of unit conversions to each input. Its 34.3 μm value is a calculated mass-to-thickness result. A supplier may identify the same material as nominal 35 μm, and a finished outer conductor can be thicker or thinner locally after plating and etching. The graphic is not a measurement of a KnownPCB product.
 Calculated theoretical copper thickness for 0.5, 1, 2, and 3 ounces per square foot.](/upload/image/20261026/copper-ounce-to-micron.webp "[copper-ounce-to-micron.webp](/users/mac/desktop/knownpcb/素材1/weekly-2026-10-26/technical/pcb-copper-thickness-calculation/copper-ounce-to-micron.webp) calculated theoretical copper thickness for 0.5, 1, 2, and 3 ounces per square foot.")
The bars show theoretical mass-to-thickness conversions using a stated copper density.
Base copper is the foil present on the laminate before the circuit pattern is formed. Finished copper describes what remains on a conductor after the relevant processing steps. On an inner layer, the starting foil is imaged and etched before lamination. On an outer layer, the starting foil is typically combined with copper deposited during the plated-through-hole process, then patterned and etched. The amount added or removed depends on the construction and process sequence.
That means "1 oz base copper" and "1 oz finished copper" are not interchangeable drawing notes. The first identifies an incoming material basis. The second describes a conductor requirement at a later point and needs an agreed measurement location, method, and acceptance rule. If a drawing only says "1 oz," ask whether it means starting foil, a nominal construction, or a minimum finished value. Do not infer the answer from a product photo or from a generic conversion table.
IPC-4562B covers metal foil for printed-board applications. Its scope separates copper-foil area weight and thickness topics and distinguishes foil types such as electrodeposited and wrought material. It is a foil specification; it does not replace the finished-copper requirement for a patterned PCB conductor. IPC-4562B scope and contents.
The comparison below is symbolic. It shows why a finished cross-section can contain a base-foil contribution plus a plated contribution, but it does not assign either layer a numeric thickness. A microsection or controlled drawing supplies those values.
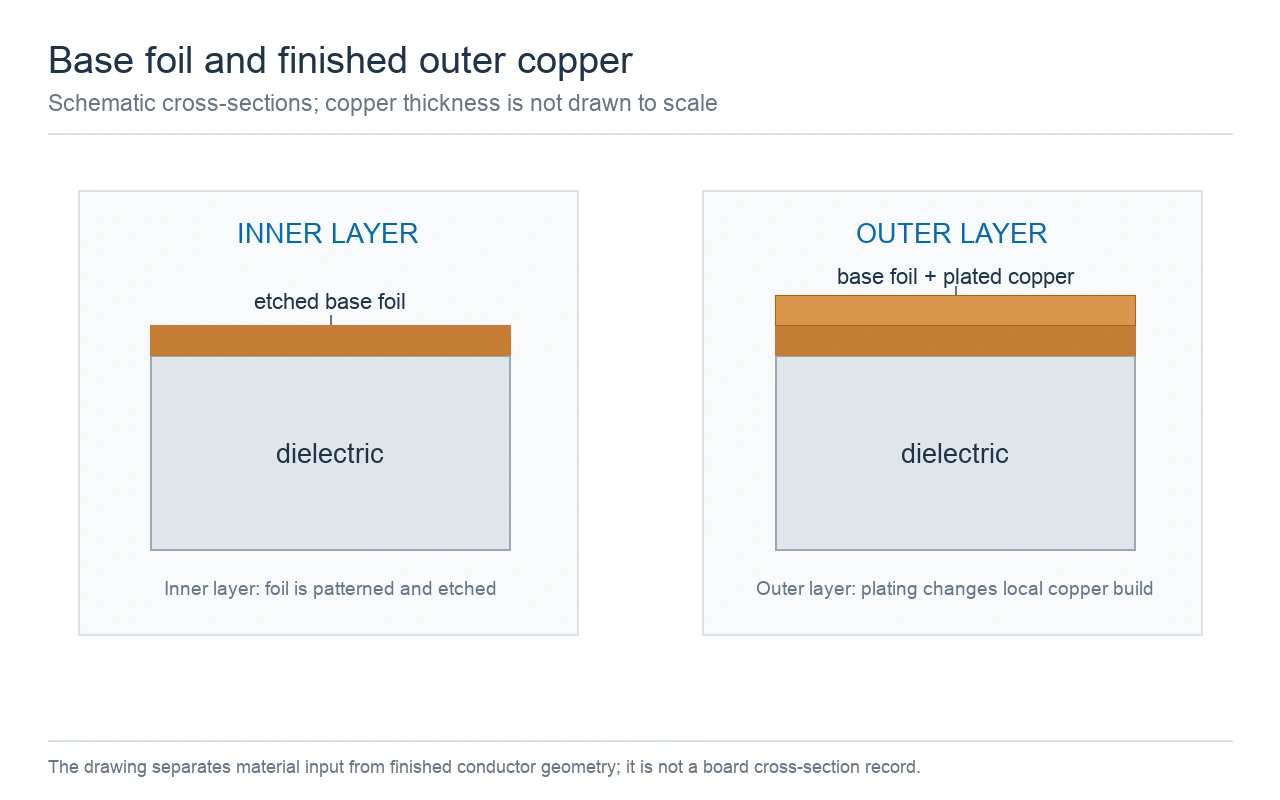
Inner and outer layer cross-sections differ because outer-layer plating changes the copper build.
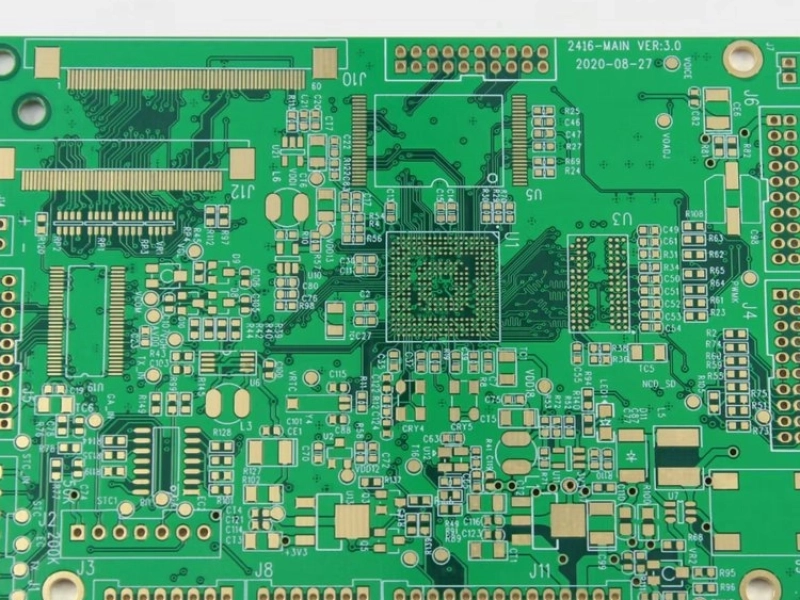
A surface photograph can show routing, pad shape, finish, and exposed copper. It cannot show the hidden layer stack or quantify copper under solder mask. If thickness matters to an electrical or thermal model, identify whether the value comes from a drawing, a material certificate, a test coupon, or a measured cross-section. Keep that evidence with the board file revision used for the calculation.
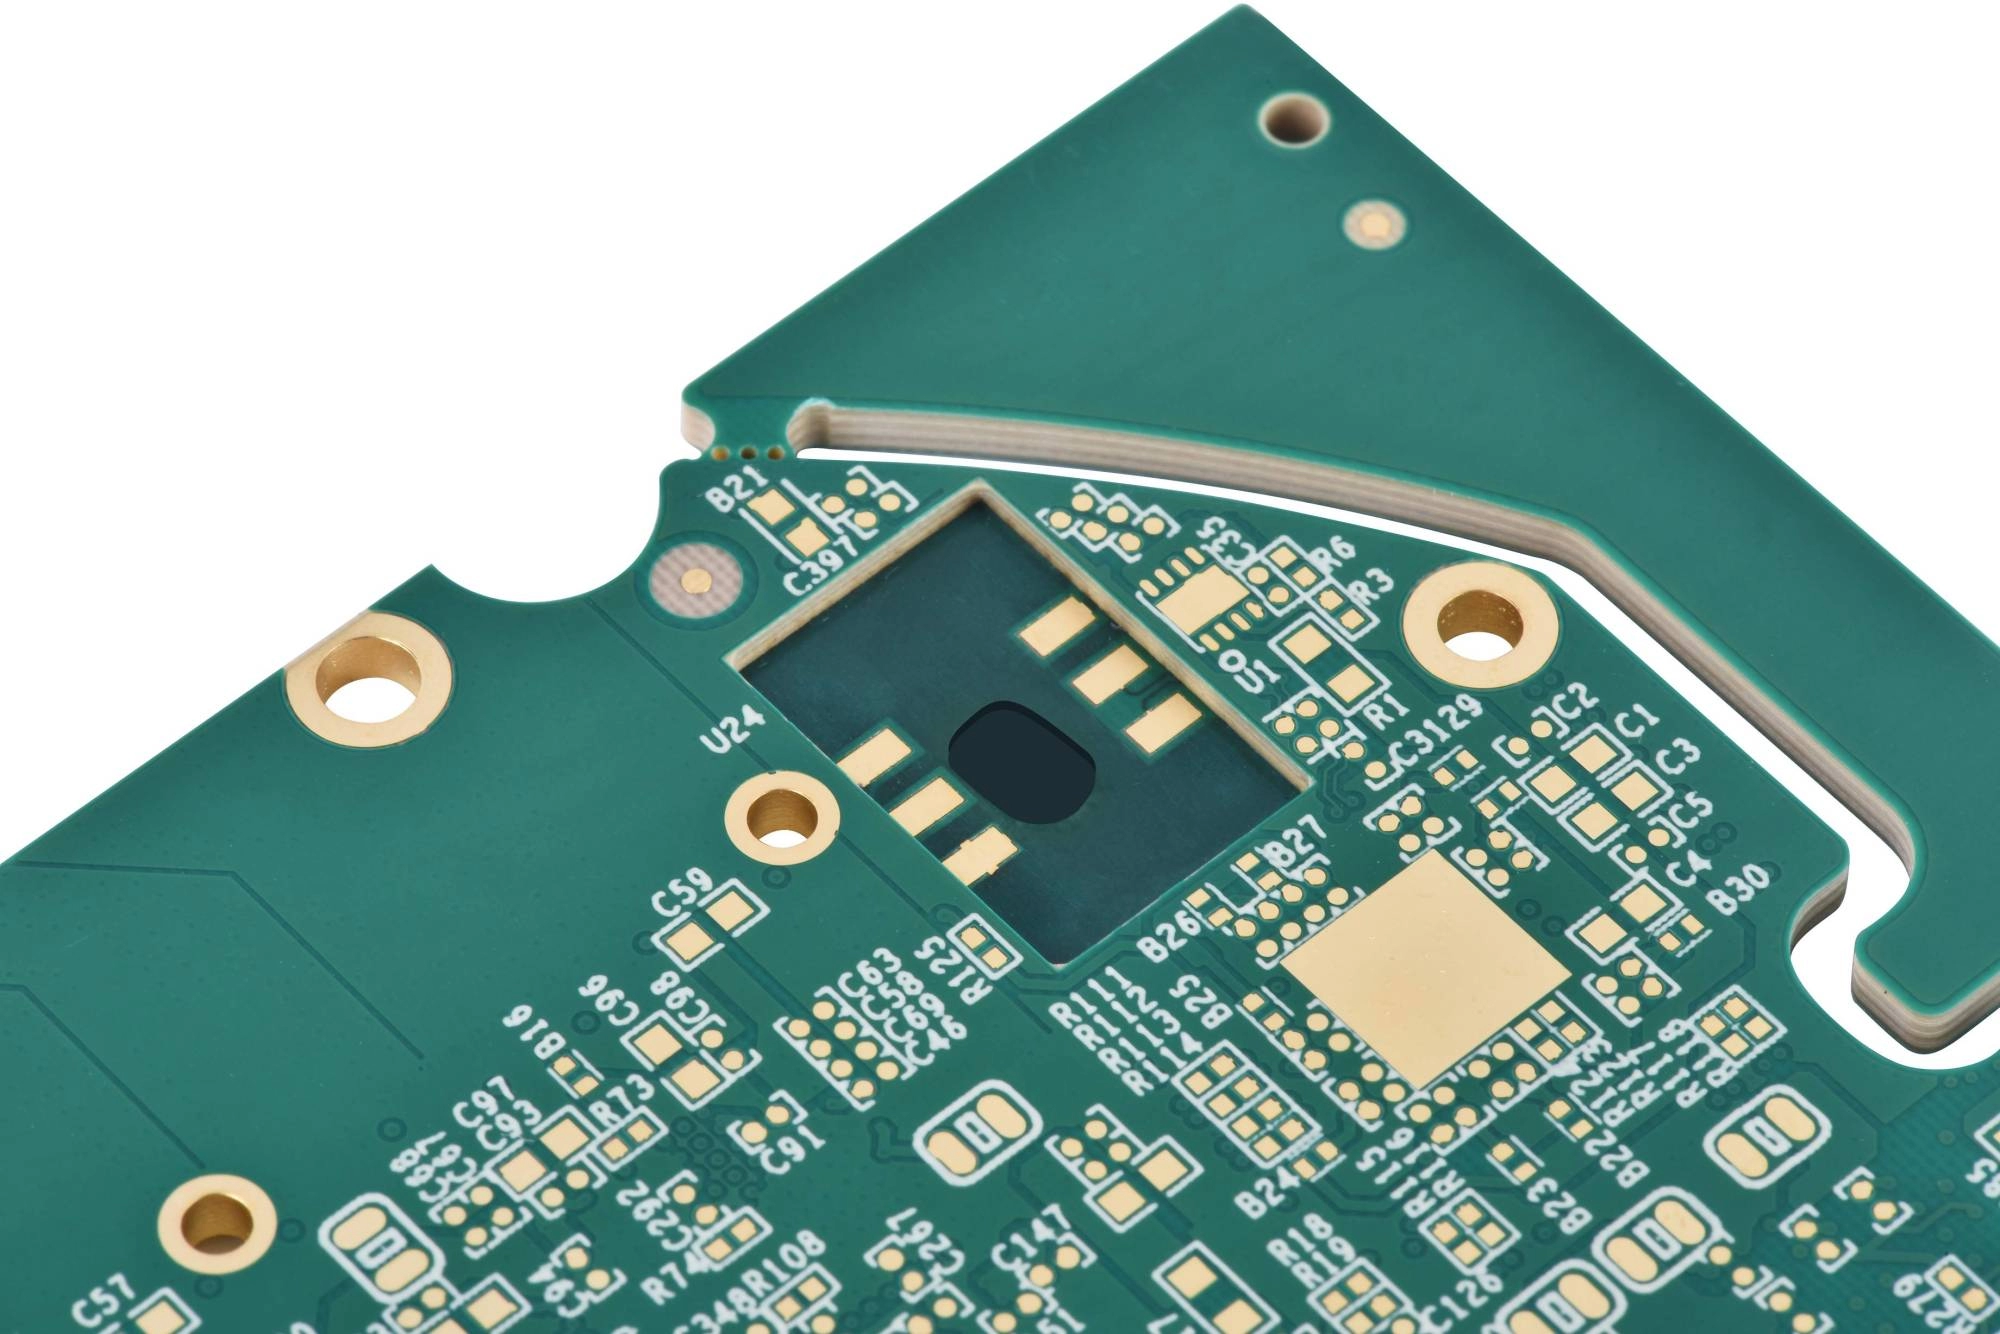
The board photograph shows surface features only; it is not a copper-thickness measurement.
Wet etching removes copper from the field and also attacks the trace sidewalls. The top width and board-facing base width can differ. One may be wider than the other, depending on the etch profile. For a simple trapezoid estimate, average the top and bottom widths instead of choosing one width and multiplying it by thickness.
A = t × (w_top + w_bottom) / 2
Use millimetres consistently: a thickness of 34.325 μm is 0.034325 mm, not 34.325 mm. If the drawing gives a nominal width but the finished width is available from inspection, the measured top and bottom values provide a better conductor-area estimate. For a rounded or strongly undercut profile, the trapezoid remains an approximation; use the actual cross-section geometry or a conservative area bound.
The equation estimates area from geometry. It does not include copper roughness, small voids in the copper, plating porosity, solder-mask effects, or local thickness changes near a pad or narrow trace section. Those details can affect a critical design. In that case, request a cross-section sample at a representative feature and record the board side, net, and location being measured.
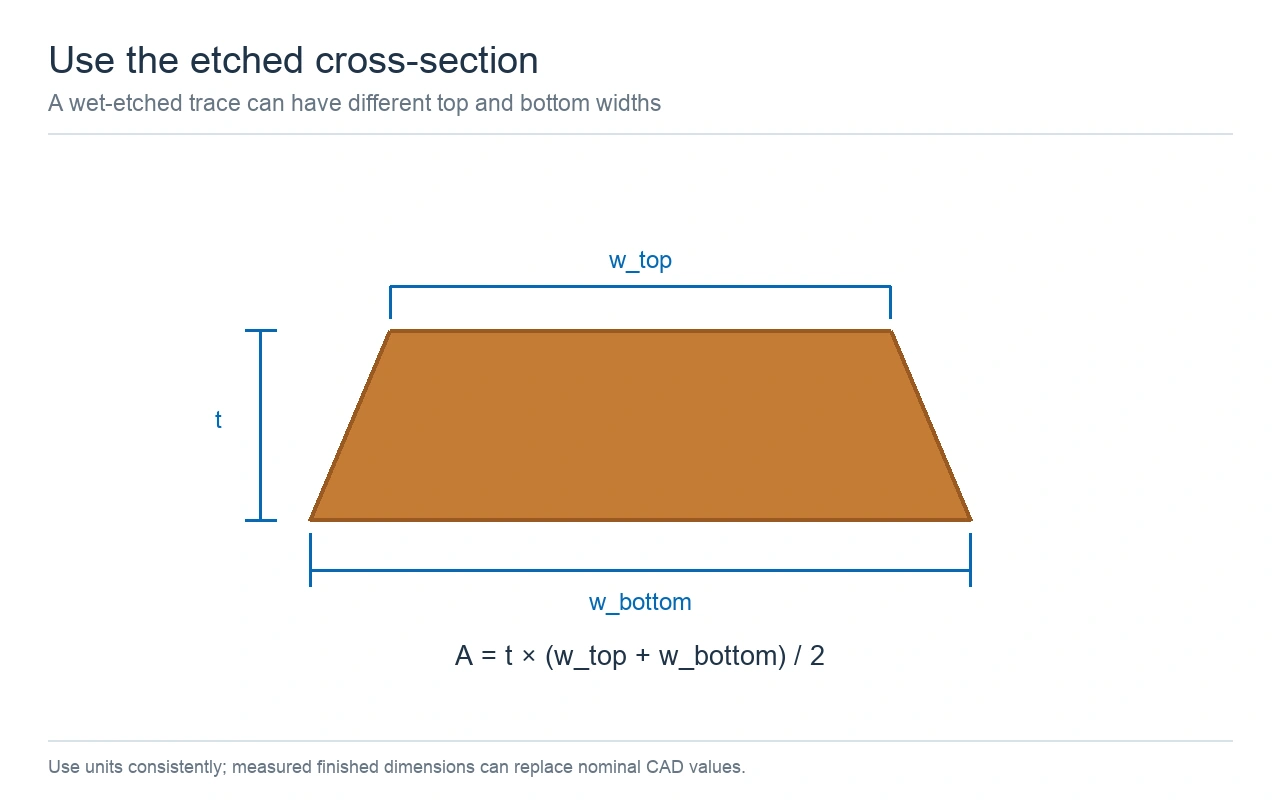
A trapezoid uses both measured widths when estimating the copper area.
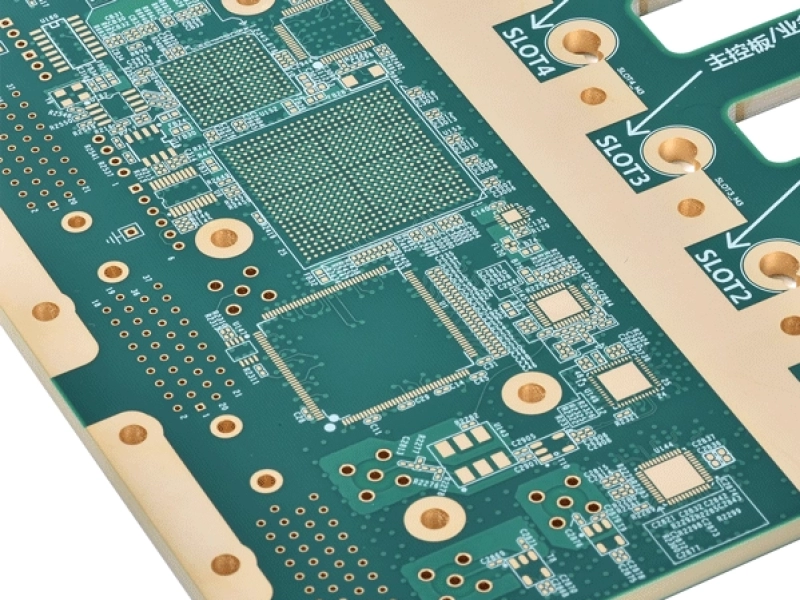
A separate panel photograph can help readers recognize how patterned lands and fine traces look before a cross-section is taken. It still says nothing about the buried copper thickness or the wall profile of a particular net.
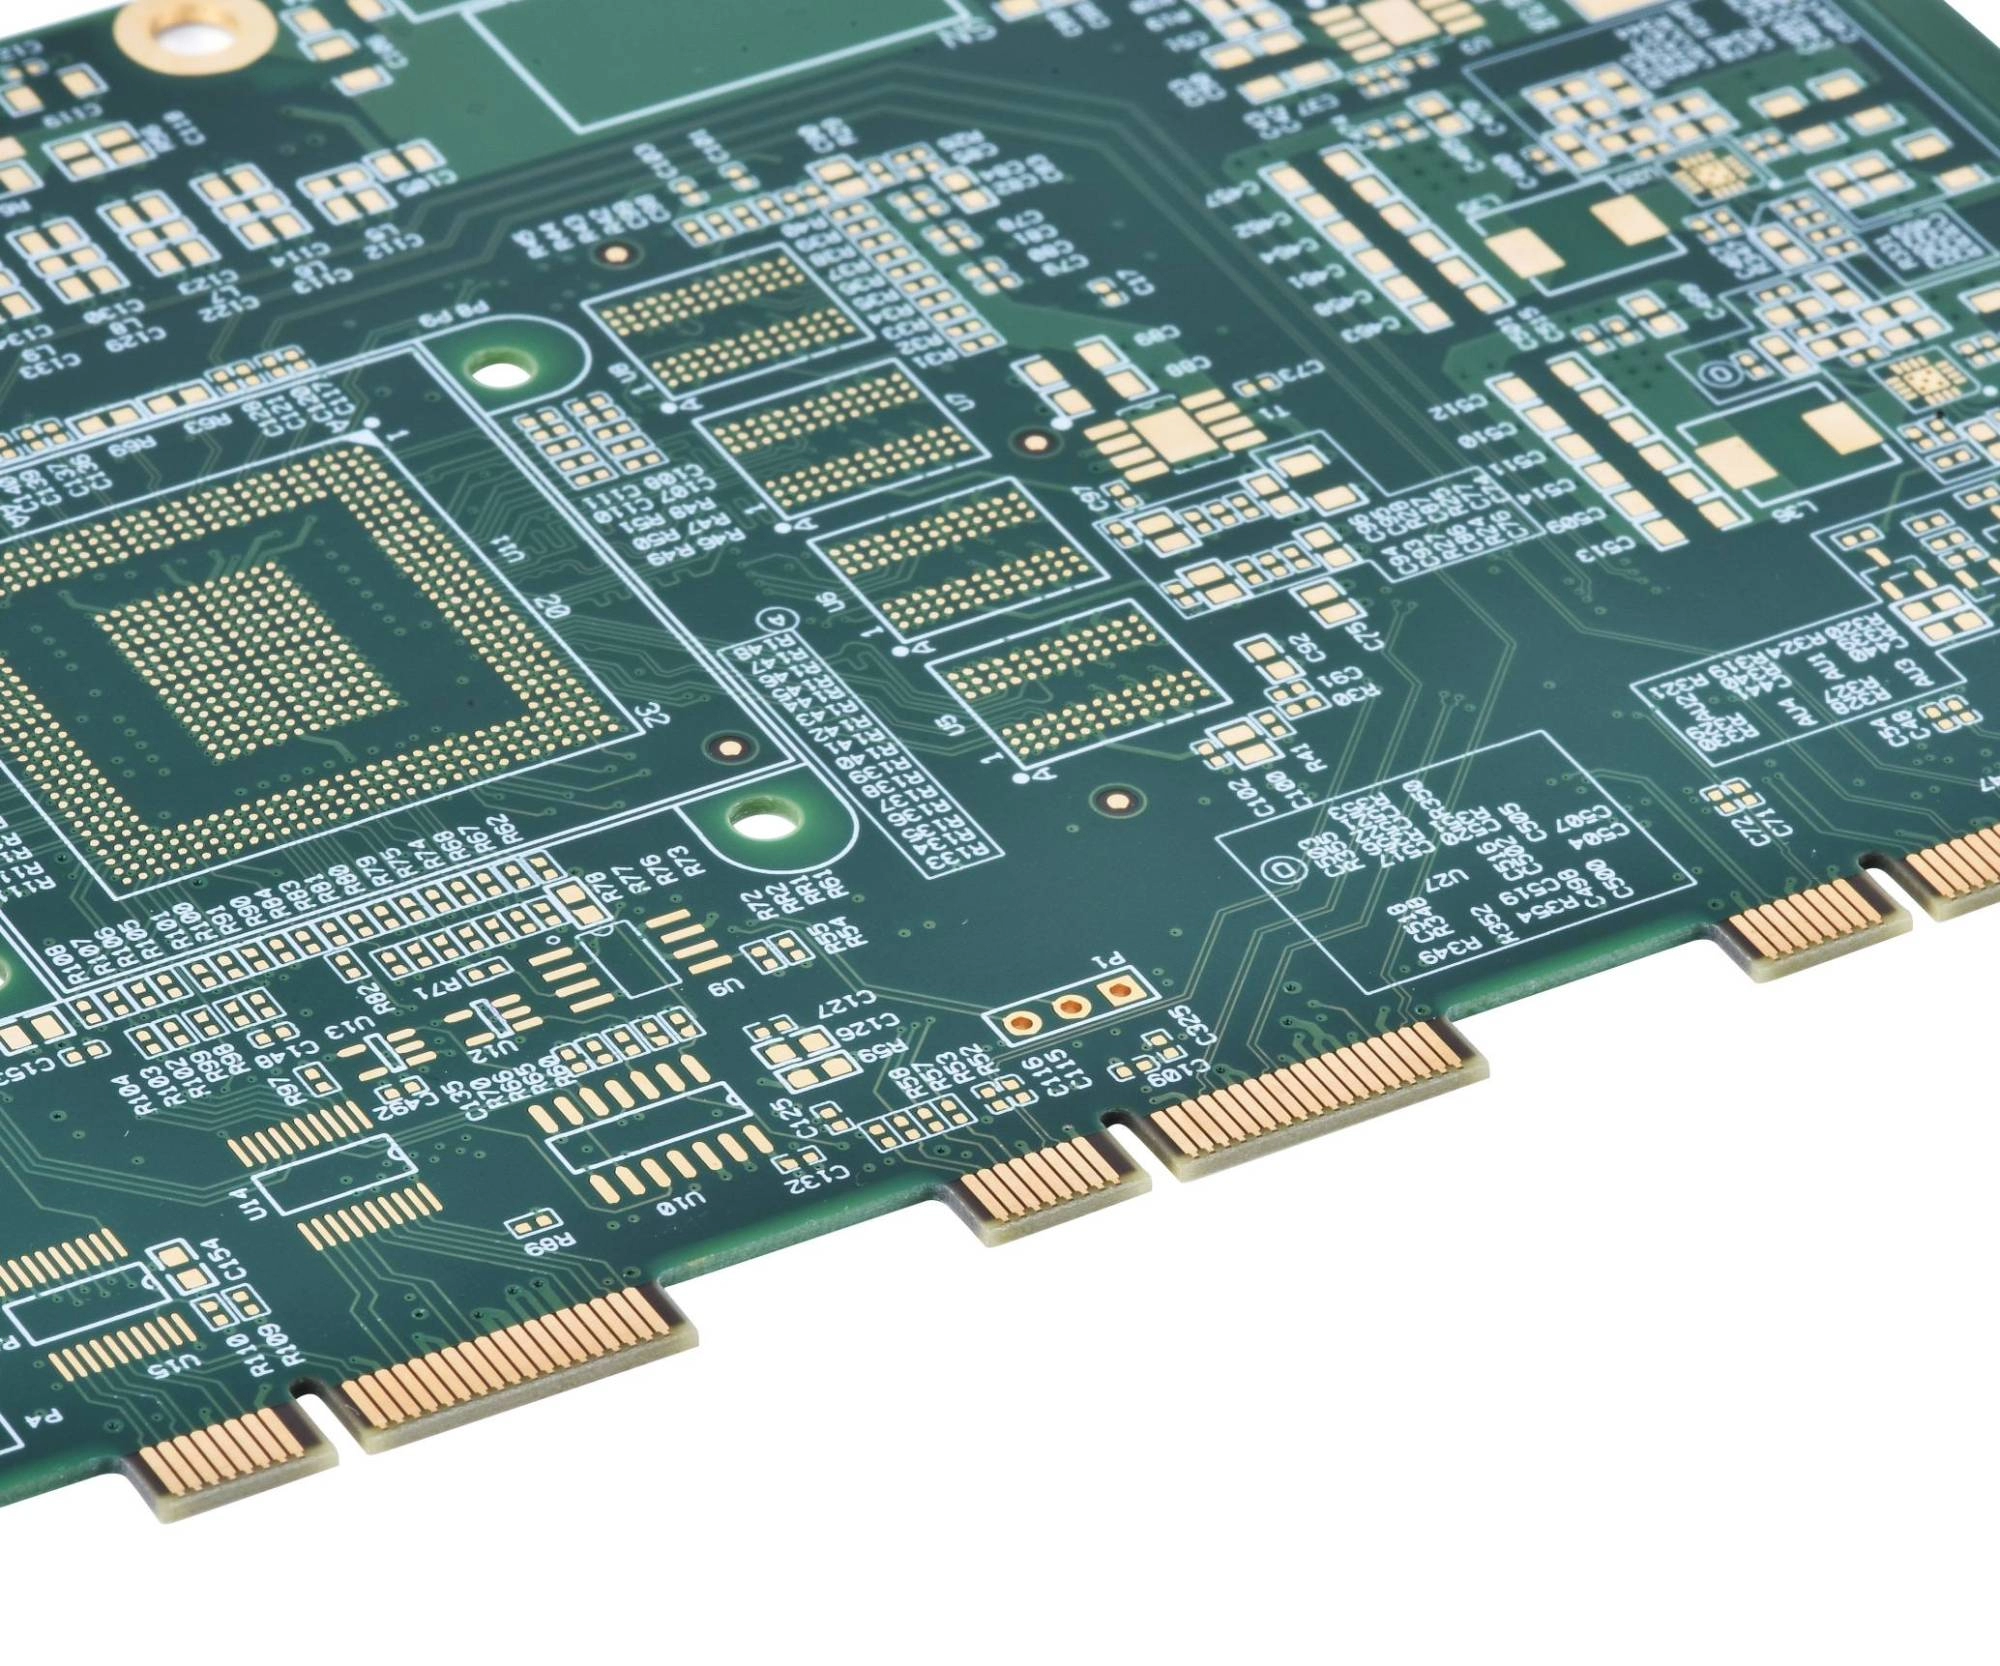
A patterned PCB panel illustrates visible copper features, not the internal conductor cross-section.
For a uniform conductor at a stated temperature, multiply resistivity by length and divide by cross-sectional area. Resistivity is a material value that links a conductor's length and area to its electrical resistance. The NIST value for standard annealed copper at 20 °C is 1/58 Ω mm²/m, or about 0.017241 Ω mm²/m. This is a reference value, not a measurement of a particular trace. Copper purity, temperature, geometry, and process variation can change the result.
R20 = ρ20 × L / A
Example 1: a 100 mm, 1 oz trace. Use the theoretical 1 oz thickness of 34.325 μm, or 0.034325 mm. Assume the finished trace has a 0.24 mm top width and a 0.30 mm bottom width. The average-width area is 0.034325 × (0.24 + 0.30) / 2 = 0.009268 mm². With L = 0.100 m, R20 = 0.017241 × 0.100 / 0.009268 = 0.186 Ω. Every input is explicit, so a different cross-section can be substituted without changing the method.
The 0.186 Ω result is a conductor-only estimate between the assumed endpoints. It omits connector, via, solder-joint, and contact resistance. It also assumes the current follows a uniform section. A narrow neck, a long path around a plane split, or multiple branches changes the current path and therefore the effective resistance.
Once resistance is known, estimate voltage drop with Ohm's law and heat loss with I²R. These calculations describe the electrical effect of the assumed resistance. They do not tell you whether the board can safely carry that current in its enclosure.
V_drop = I × RP_copper = I² × R
Example 2: the same trace at 0.5 A. With R20 = 0.186 Ω, the estimated voltage drop is 0.5 × 0.186 = 0.093 V. Dissipation is 0.5² × 0.186 = 0.0465 W. If the copper itself is uniformly at 60 °C, the NIST resistance temperature coefficient of 0.00393 per °C gives R60 = 0.186 × [1 + 0.00393 × (60 − 20)] = 0.215 Ω. At 0.5 A, that corresponds to about 0.108 V and 0.0538 W. The 60 °C value is an assumed conductor temperature, not a temperature-rise prediction.
The temperature correction is linear near the reference point and gives a first estimate. In an operating board, conductor temperature depends on copper area, nearby planes, dielectric layers, solder mask, airflow, heat sources, how long current flows, and the path into the enclosure. Use a measured or simulated board temperature in place of the assumed uniform value when checking a thermal limit.
The table varies one input at a time around Example 1. Its baseline uses a 100 mm trace, 0.27 mm average width, 34.325 μm copper, and a uniform 20 °C conductor. Width values are treated as rectangular equivalents for this sensitivity comparison. For a trapezoid, keep the top and bottom dimensions and recalculate area directly.
| Changed parameter | Input | Estimated resistance | What stays fixed |
|---|---|---|---|
| Length | 50 mm | 0.0930 Ω | 0.27 mm width, 1 oz, 20 °C |
| Length | 150 mm | 0.2791 Ω | 0.27 mm width, 1 oz, 20 °C |
| Average width | 0.20 mm | 0.2511 Ω | 100 mm length, 1 oz, 20 °C |
| Average width | 0.35 mm | 0.1435 Ω | 100 mm length, 1 oz, 20 °C |
| Copper weight | 0.5 oz/ft² | 0.3721 Ω | 100 mm length, 0.27 mm width, 20 °C |
| Copper weight | 2 oz/ft² | 0.0930 Ω | 100 mm length, 0.27 mm width, 20 °C |
| Copper temperature | 40 °C | 0.2007 Ω | 100 mm length, 0.27 mm width, 1 oz |
| Copper temperature | 60 °C | 0.2153 Ω | 100 mm length, 0.27 mm width, 1 oz |
The graph holds length and average width constant while changing copper weight. Doubling thickness approximately halves calculated resistance because cross-sectional area doubles. Doubling width has the same proportional effect in this model. A narrow section on a long trace can matter more than a small temperature change on a short branch.
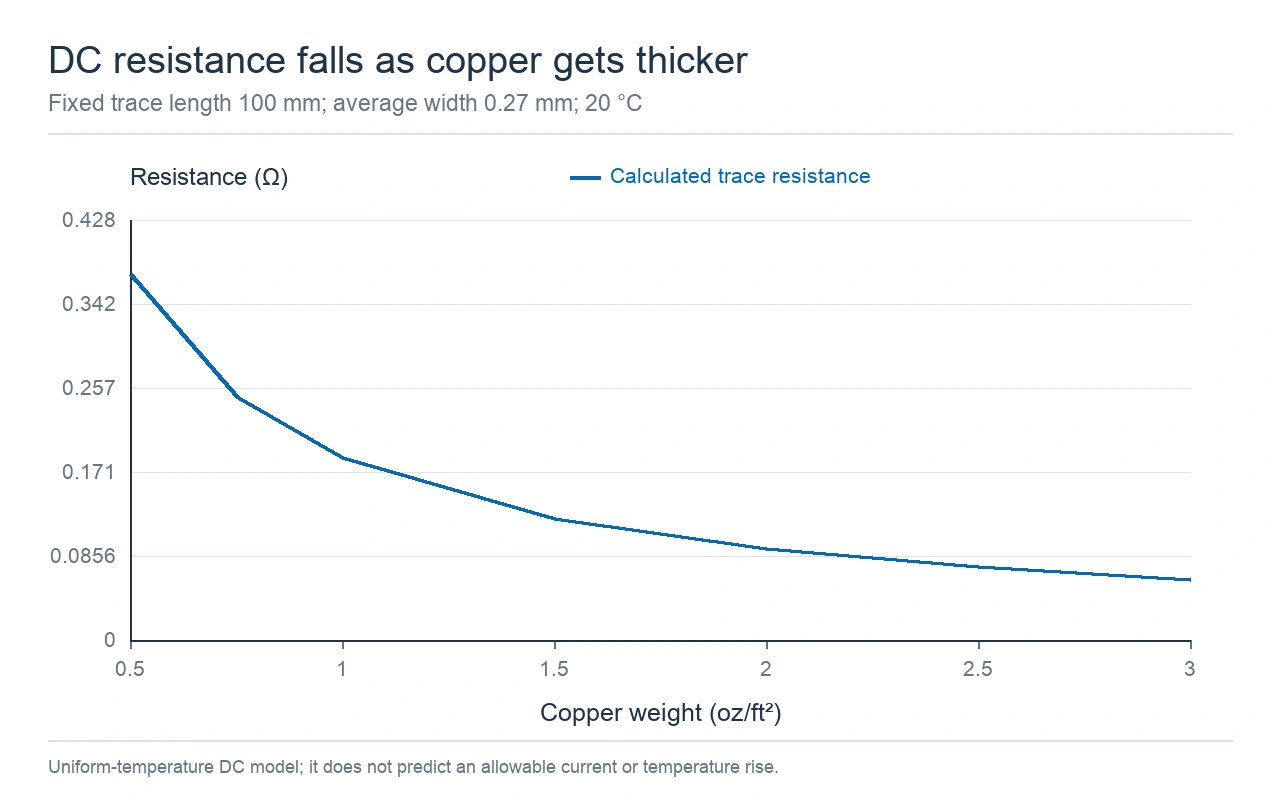
The ideal DC model predicts lower resistance as copper cross-section increases.
Do not turn this resistance estimate into a universal current rating. To choose an allowable current, set a maximum temperature rise and describe how the board sheds heat. Include the layer arrangement, nearby copper planes, trace spacing, board position, airflow, load duration, nearby heat sources, and product operating temperature. The same calculated resistance can produce different temperatures on different boards and in different enclosures.
The DC equation becomes incomplete at frequencies where skin effect pushes current toward the copper surface or nearby conductors crowd the current path. Copper surface roughness can affect high-frequency loss even though it has little effect on a low-frequency DC estimate. The return path and connection changes also add loss. For those designs, use the specified copper profile and material data in an electromagnetic field simulation or channel simulation, then compare the result with the project's measurement method.
Printed-board copper is not always a uniform sheet. Foil roughness, uneven plating, side etching under the trace edge, resin flow, small voids, and local pattern density can alter the finished section. The NIST reference constants make the calculation reproducible, but they do not describe those construction details. To match a production build, use its stackup, cross-section, material certificate, and supplier acceptance notes.
A useful drawing or request for quotation (RFQ) states the copper basis and the point in the process where it applies. Name each layer's starting foil, specify any required finished-copper minimum, identify whether the requirement applies to a plane, trace, or plated barrel, and say how the value will be checked. If a tolerance matters, write the tolerance and measurement location instead of relying on a "1 oz" label alone.
For a thicker copper build, see the KnownPCB heavy-copper PCB page. The existing high-current heavy-copper article covers separate manufacturing questions. This calculation does not use a general trace-current figure from either page. Send the released stackup, required finished copper, minimum trace width, and thermal requirement for a project review.
Use the equations here to check whether a trace geometry has a plausible resistance. Use the fabrication drawing and measured section to confirm what was built. They answer different questions, so keep both with the board revision.
Proven by 7 industries, 4000+ customer projects
Please contact us at sales@knownpcb.com, ask for engineering support here or use the form below to reach out to KnownPCB | Request a Manufacturing QuoteInclude your quantity, target delivery date and key requirements. File handling and NDA information. |