
PCB copper roughness and skin depth describe two different things. Skin depth is a calculated distance inside a conductor at a given frequency. Roughness is measured from a copper surface with a defined instrument and method. Comparing the two can show whether surface texture is on a similar scale to the current distribution, but the comparison does not predict a complete transmission loss.
This guide calculates skin depth and smooth-copper surface resistance at 1 GHz and 10 GHz. It also explains how to read Rz, Rq, and Sq without treating one roughness number as a complete loss model.
In this article
For a good conductor under the usual high-frequency approximation, skin depth is:
δ = √(ρ ÷ (π f μ))
Here, δ is measured in metres, ρ is electrical resistivity in ohm metres, f is frequency in hertz, and μ is magnetic permeability in henries per metre. For a non-magnetic metal such as copper, use μ = μ0 × μr and take μr as approximately 1 for this estimate. Keysight's PCB material-characterization guidance uses skin depth as an input to its conductor roughness model.
Skin depth is the depth at which the field amplitude inside the conductor falls to 1/e of its surface value. It does not mean that all current stops at a sharp boundary. Current density falls with depth, and more of the current is concentrated near the surface as frequency rises.
The copper cross-section below shows that change in current density and exaggerates the surface texture so it can be seen. The roughness shape is a concept drawing. It is not a copper-foil sample or a microscope result.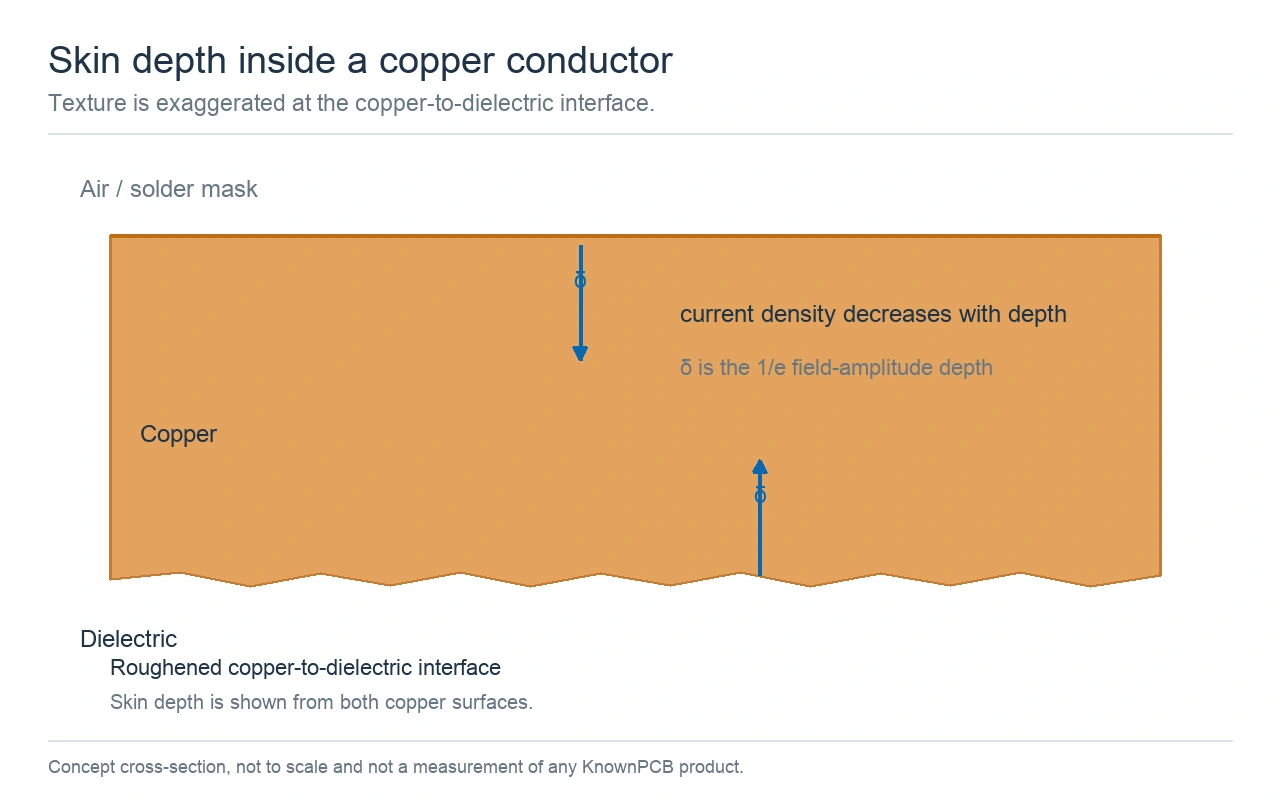
Concept cross-section showing the direction of current decay. The drawing is not to scale and contains no measurement data.
In a PCB transmission line, the conductor surface facing the dielectric can matter to the field distribution. Rogers describes different copper-foil surfaces and measurement methods in its copper foil reference for high-frequency materials. The measured side must be named because the treated side and the opposite side can have different topography.
A finished multilayer PCB photograph gives visual context for copper artwork and board construction. It cannot show the surface profile at a copper-to-dielectric interface or the skin depth of a routed signal.
Finished-board photograph for product context. It is not a copper roughness or signal-loss measurement.
For the worked examples, use copper resistivity ρ = 1.72 × 10⁻⁸ ohm metres at 20°C, μr = 1, and μ0 = 4π × 10-7 henries per metre. These are stated calculation inputs. Temperature and copper condition can change resistivity, so replace the value if a project specifies another condition.
The smooth-conductor surface resistance follows from Rs = ρ ÷ δ. Substituting the skin-depth equation gives:
Rs = √(π f μ ρ)
Rs is reported in ohms per square. It describes the surface resistance of a smooth, uniform conductor under the stated approximation. It is not the total resistance of a PCB trace and it is not the insertion loss of a channel.
Worked example one uses f = 1 GHz. Substituting the copper values gives δ = 2.087 μm and Rs = 8.240 milliohms per square. This is a smooth-copper calculation at 20°C.
Worked example two uses f = 10 GHz with the same copper inputs. The results are δ = 0.660 μm and Rs = 26.058 milliohms per square. A tenfold rise in frequency reduces δ by √10 and raises Rs by √10 under this model.
The frequency curve below spans 10 MHz to 100 GHz. It uses the same copper assumptions as the two worked examples. Read the axis as logarithmic. The exact 1 GHz and 10 GHz values are listed above rather than estimated from the curve.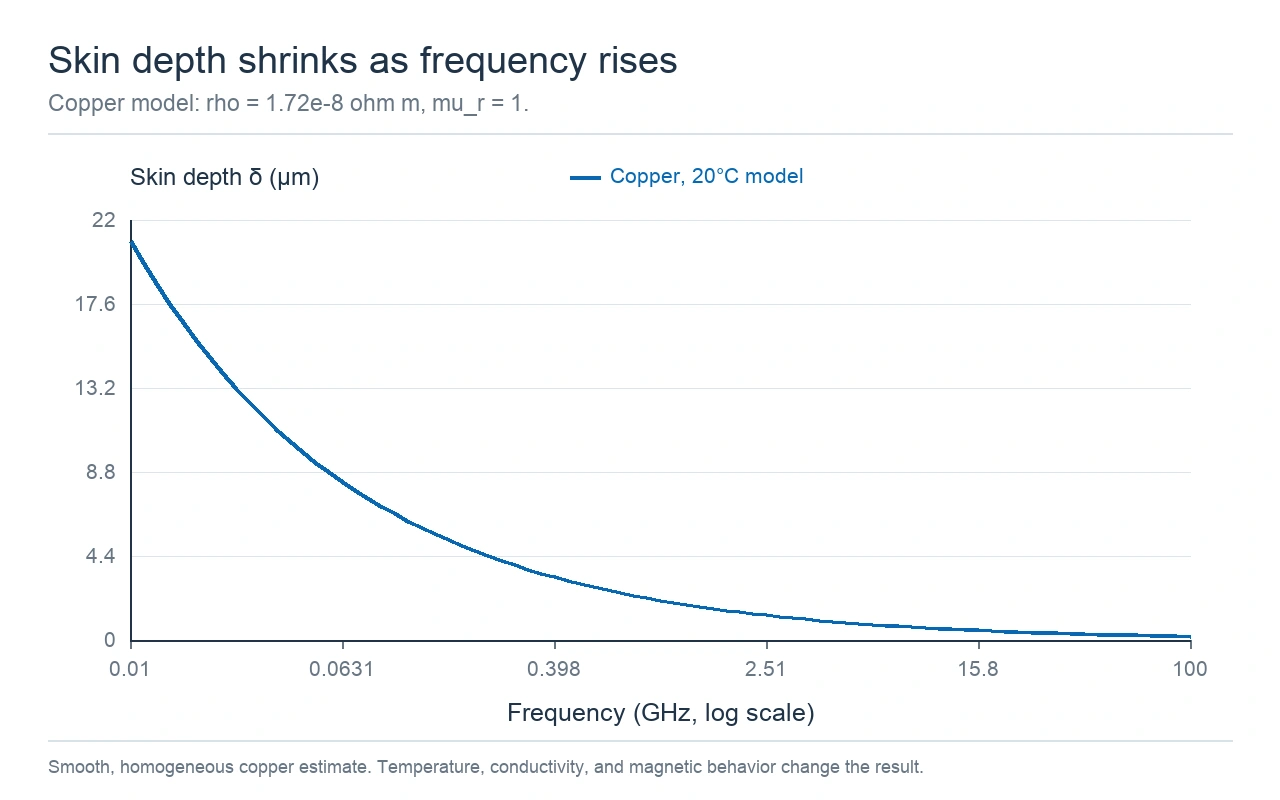
Calculated skin depth for copper at 20°C with μr = 1. The curve excludes roughness and PCB geometry.
| Frequency | Skin depth δ | Smooth copper Rs |
|---|---|---|
| 0.1 GHz | 6.601 μm | 2.606 mΩ/□ |
| 0.5 GHz | 2.952 μm | 5.827 mΩ/□ |
| 1 GHz | 2.087 μm | 8.240 mΩ/□ |
| 5 GHz | 0.933 μm | 18.426 mΩ/□ |
| 10 GHz | 0.660 μm | 26.058 mΩ/□ |
| 50 GHz | 0.295 μm | 58.268 mΩ/□ |
| 100 GHz | 0.209 μm | 82.403 mΩ/□ |
Rz and Rq describe a profile measured along a line. Rz is a profile height value based on peaks and valleys. Rq is the root mean square height of the filtered profile. Their values depend on the standard, standard version, sampling length, filtering, stylus or optical instrument, and the way the profile is prepared.
Sq describes the root mean square height of a measured surface area. A digitized measurement calculates it from the height values across the defined x and y area after the selected form and filtering steps. NIST's surface-parameter reference defines Sq from the areal topography, rather than from one line profile.
The calculation behind Rq and Sq is the root mean square of the measured height deviations from the chosen mean line or mean surface. For a profile, Rq uses the height samples along one measured line. For an area, Sq uses the height samples across both x and y directions. Rz instead uses peak and valley heights, so a few extreme points can affect it more than they affect a root mean square value.
Rz also depends on the named profile standard. Different revisions and standards can define the sampling length or evaluation length differently, and some report a maximum height while others report an average of section values. State the standard and revision before comparing supplier data. A number labeled only “Rz” is not a complete measurement method.
Rz, Rq, and Sq are not interchangeable labels. A profile may miss local peaks elsewhere on the foil. An areal value depends on the scanned area and processing settings. A report that gives only one number without its method does not provide enough information to compare two copper surfaces.
The diagram below contrasts a profile height measurement with an areal RMS measurement. It uses a synthetic shape to explain the measurement types. It contains no foil scan or sample values.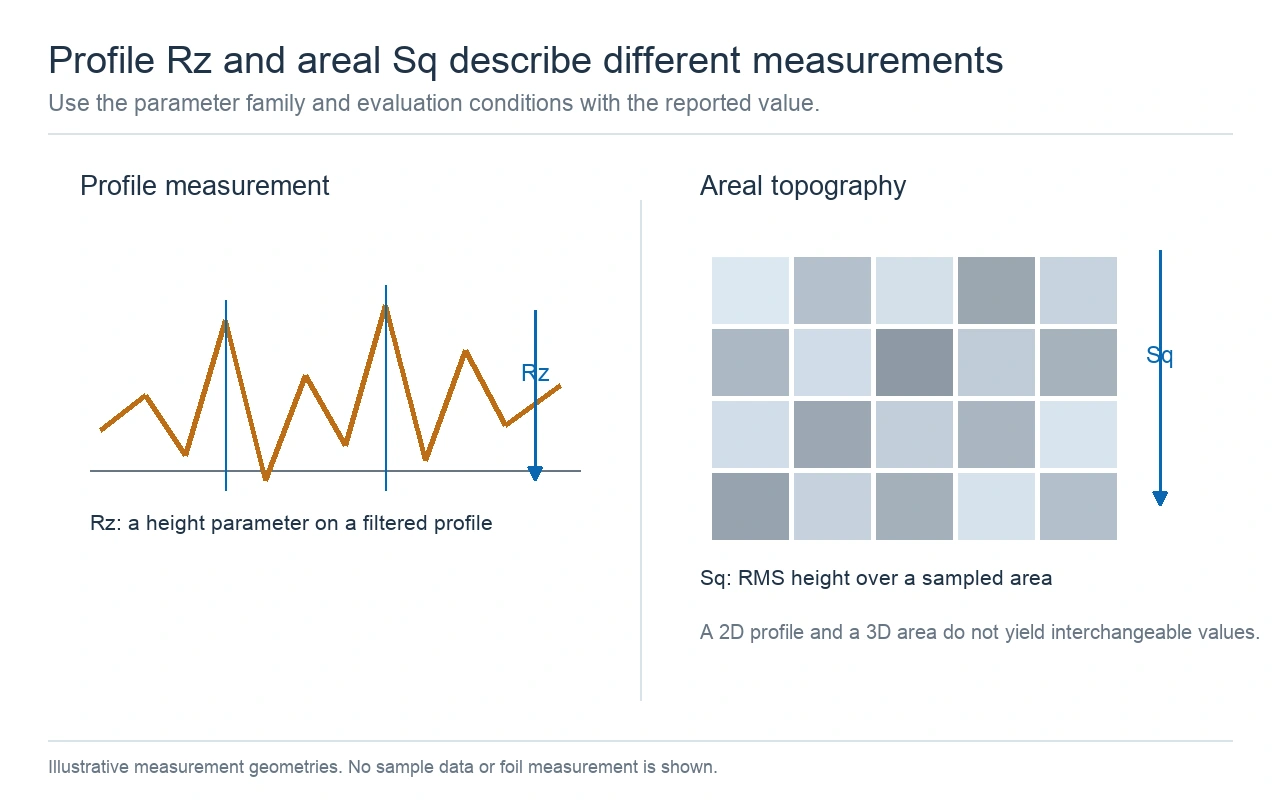
Concept comparison of profile and areal surface measurements. The shapes are synthetic and not measured copper data.
Keep the measured side visible in the record. Electrodeposited and rolled foils can have different topography on their two sides, and the treated side that meets the dielectric may differ from the exposed side. Rogers discusses these foil-side differences and compares optical and mechanical roughness methods in its copper-foil reference. The measurement method and side should travel with the value.
A pattern-plating line is shown below as general PCB production context. It does not measure foil topography, skin depth, or electrical loss.
Pattern-plating equipment shown for process context. No surface roughness or electrical test result is visible.
Surface roughness on the inside wall of a drilled plated-through hole is a separate measurement from copper-foil surface topography. KnownPCB's article on PCB hole-wall roughness covers the drilled-hole wall and its cross-section inspection. Do not transfer its inspection values to the copper-to-dielectric interface of a signal trace.
A scale comparison can help you ask whether a roughness value is close to the calculated skin depth. For example, use a hypothetical areal Sq of 0.8 μm. This is a made-up input for the calculation, not a measured Rogers foil or KnownPCB board.
At 1 GHz, δ is 2.087 μm, so δ/Sq is about 2.61. At 10 GHz, δ is 0.660 μm, so δ/Sq is about 0.83. The comparison shows how the same assumed surface value becomes closer to the current-depth scale as frequency rises.
Do not read these ratios as a loss multiplier or a pass/fail threshold. Skin depth measures field decay into a conductor. Sq averages surface height over an area. A single Rz value records a profile height under one method. Those values do not contain the full shape, spacing, direction, or spatial wavelengths of the copper features.
Two surfaces can have the same Rz but different peak spacing and shape. Their effects on a transmission line can differ because current follows the surface and the nearby field. An areal parameter gives more height data than one profile, but Sq still compresses that map to one average value. It does not preserve every detail needed by a conductor-loss model.
Keysight's material-characterization method uses a measured trace or S-parameter file together with stackup and conductor inputs to fit its dielectric and roughness models. Its guidance shows why the frequency response needs a defined channel and method. One roughness number alone cannot supply the missing geometry or measurement data.
The Rs formula above is for the smooth-conductor surface term. It does not include a PCB line's width, thickness, return conductor, proximity effect, dielectric loss, plating, solder mask, connectors, or launches. Those factors shape current distribution and the loss that a channel model reports.
At high frequency, current flows near the conductor surfaces that carry the strongest field. A microstrip and a stripline have different field distributions and return paths, so the same copper foil can produce different conductor loss in the two structures. The trace width, spacing, substrate thickness, copper treatment, and ground geometry also change the result.
Roughness corrections use additional information about the surface and the transmission-line geometry. Rogers discusses several roughness models and explains that model inputs need to match the foil and test conditions. If a model asks for a parameter that a datasheet does not report, do not substitute Rz or Sq without checking that the model defines it that way.
A complete insertion-loss curve or S21 requires a channel definition and a stated measurement or simulation method. One Rz value cannot determine S21. It cannot account for dielectric loss, return-path geometry, conductor thickness, or the rest of the interconnect. Keep the skin-depth calculation as one input to a larger analysis.
The KnownPCB high-frequency and high-speed PCB page provides product context for high-frequency board designs. It does not replace the material test data or the line model for a specific trace.
The smooth-copper Rs curve below uses the same 20°C copper inputs. It shows only the calculated conductor surface resistance per square. It is not a trace resistance or a channel S21 curve.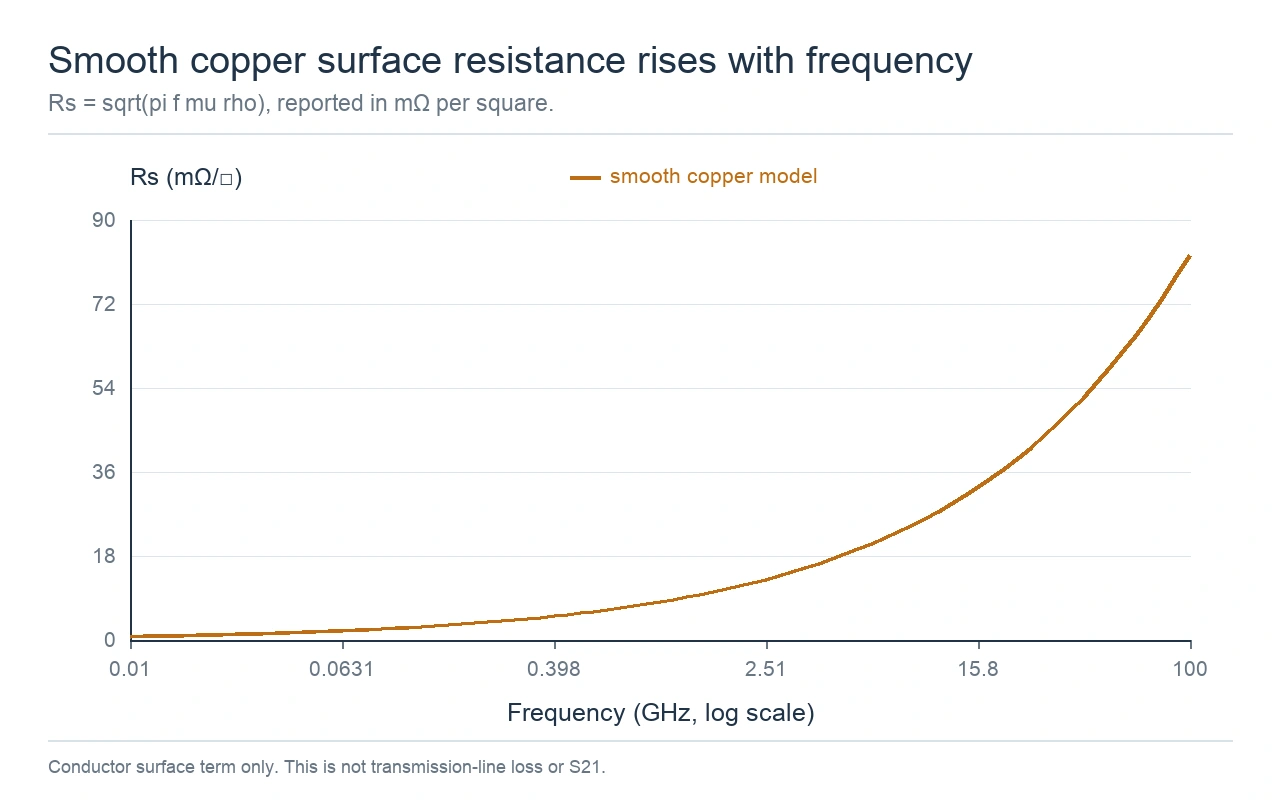
Smooth-copper surface-resistance term at 20°C. It is not a complete transmission-line loss or S21 result.
When a design or supplier record reports roughness, ask for the details that make the number repeatable. The required fields depend on whether the value describes a 1D profile or a 2D area.
For a modeled line, keep those copper inputs beside the stackup and conductor model. A roughness value alone cannot establish a maximum loss or a finished-board acceptance limit. Keep the foil measurement, model choice, and channel result as separate records so an engineer can see which evidence supports each decision.
October/22/2026Telecom PCB Manufacturing: Release the Critical Channel
December/06/2025What Are The HDI Board Risks for Radar Modules
October/22/2026Double Sided Metal Core PCB: Layers and Hole Isolation
October/08/2026Single-Sided vs. Double-Sided PCB: Routing and Cost
October/21/2026PCB TDR Impedance Test: Read the Lot Report