
Get A Quote
CN
PCB Z-axis CTE describes how a laminate changes thickness as temperature changes. For a multilayer board with plated through holes, that movement matters because the glass and resin expand differently from the copper barrel. A datasheet can help estimate free laminate growth, but it cannot predict via life by itself.
The useful calculation is based on the temperature interval and the material's CTE across that interval. Near and above glass transition temperature, the expansion rate can change. A single room-temperature coefficient therefore does not describe every soldering or service excursion. Engineers need to keep the material test method, the temperature profile, and the board construction together.
This guide uses Isola 370HR as a worked example because its published table lists both pre-Tg and post-Tg Z-axis CTE, along with total expansion from 50 to 260°C. The example shows why two headline CTE values do not always reproduce the measured total. It also shows why multiplying a board thickness by total expansion is only a free-material estimate, not a plated-through-hole strain or a service-life result.
Contents
The coefficient of thermal expansion, or CTE, is the fractional length change per degree of temperature change. For a material with a constant CTE over a small interval, the estimate is ΔL/L₀ = α × ΔT. Here, L₀ is the starting length, α is the linear CTE, and ΔT is the temperature change. If α is given in parts per million per degree Celsius, divide by 1,000,000 before multiplying.
Across a wider temperature range, CTE can vary with temperature. The more general expression is ΔL/L₀ = ∫α(T)dT. In practice, a designer may have only a few typical values from a laminate datasheet. Those values support an estimate, not a complete reconstruction of the material's expansion curve. The source temperature and end temperature must be stated because the same coefficient produces a different result over a different range.
For a PCB, direction matters. X and Y describe movement in the board plane. Z describes movement through the board thickness. Glass fabric constrains in-plane resin movement, while the resin system and laminate construction affect the thickness direction. A Z-axis CTE value must not be substituted for an X/Y value or for a copper-barrel property.
In the Isola 370HR table, the listed typical Z-axis CTE is 45 ppm/°C before Tg and 230 ppm/°C after Tg. The table also lists 2.8% total expansion between 50 and 260°C. Those are three separate reported values. The two coefficients describe slopes before and after the transition region, while the total expansion is a measured result over the full interval.
The chart below shows the two listed CTE values as a simplified step. The actual transition is not a step function. Use the graphic to understand the change in slope, not as a measured TMA trace for a production panel.
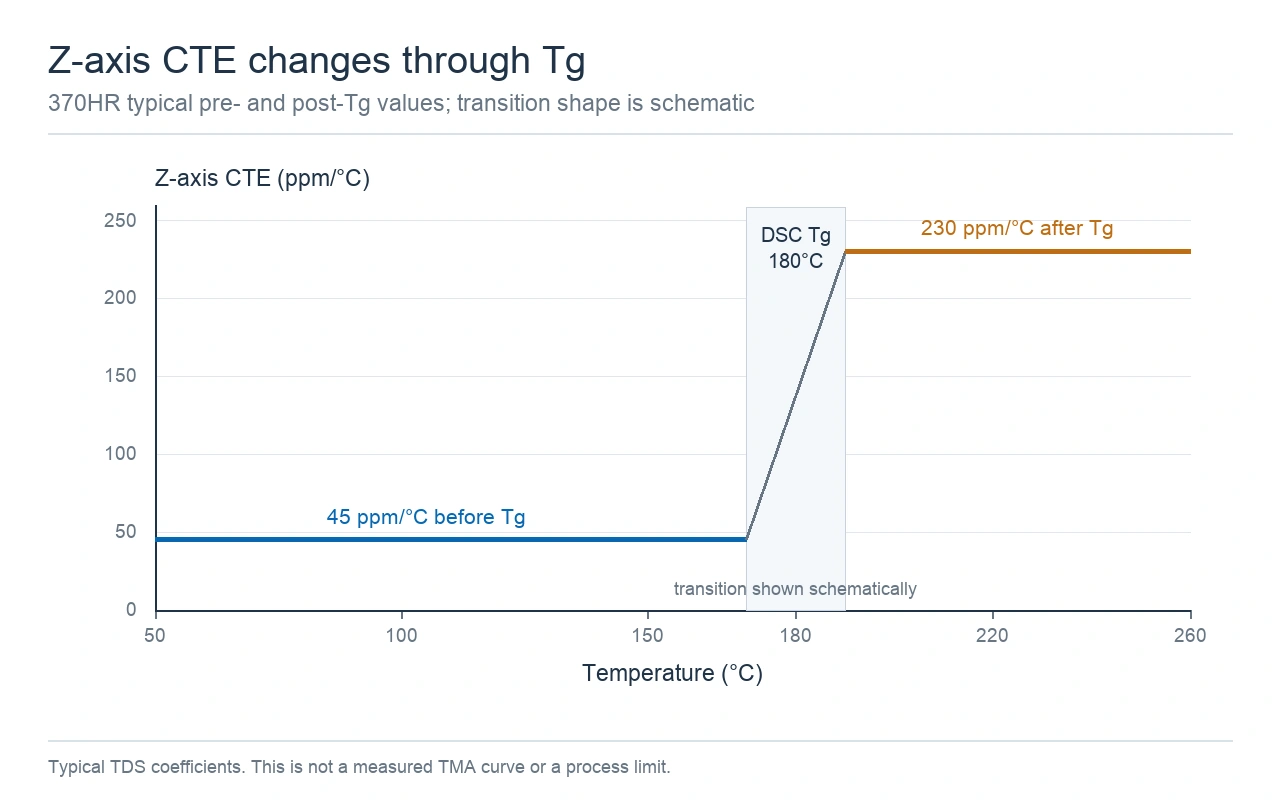
Schematic based on the listed pre-Tg and post-Tg coefficients. The transition shape is not a measured TMA curve.
An engineering review should record the full interval, not only the peak temperature. For example, a board that moves from 25°C to 180°C does not follow the same path as a sample measured from 50°C to 260°C. Moisture state, copper removal, specimen orientation, heating rate, and the method used to identify Tg can also affect what a TDS reports.
A laminate datasheet may put glass transition temperature, Z-axis CTE, decomposition temperature, and time to delamination in one table. The numbers answer different questions. They do not form a single maximum-temperature rating.
Isola reports 370HR Tg by differential scanning calorimetry, or DSC, as a typical 180°C. It reports Z-axis CTE by thermomechanical analysis, or TMA. Its TDS lists 340°C as decomposition temperature measured by thermogravimetric analysis, or TGA, at 5% weight loss. The TDS also lists T260 and T288 time-to-delamination values of 60 and 30 minutes, with copper removed. The copper-removed condition matters because the result describes the test specimen, not a finished multilayer board with its copper barrel and constraints.
Isola's 370HR technical data sheet labels these as typical values and gives a test method for each group. The table's 2.8% total expansion is reported separately from its 45 and 230 ppm/°C slopes. Do not treat the listed Td as an allowable assembly temperature, or the T260 and T288 times as a guaranteed lifetime in service.
The method names also matter. The IPC TM-650 test method directory identifies TM 2.4.24C as a TMA method for Tg and Z-axis thermal expansion, TM 2.4.24.1 as time to delamination by TMA, TM 2.4.24.6 as decomposition temperature by TGA, and TM 2.4.25D as a DSC method for Tg and cure factor. Isola's older PDF lists 2.4.25C for its DSC Tg entry. That document's method designation should be reported as printed, not silently updated to match the current directory.
Tg measured by DSC and Tg identified by TMA are not interchangeable just because both use the same name. The test method and its reported result belong in the material record. If a drawing or purchase specification calls for a test, name the method revision, specimen construction, conditioning, and acceptance value rather than writing only "high Tg".
The table graphic below separates the values by method. This is a reading aid made from the TDS entries, not a reprint of Isola's document.
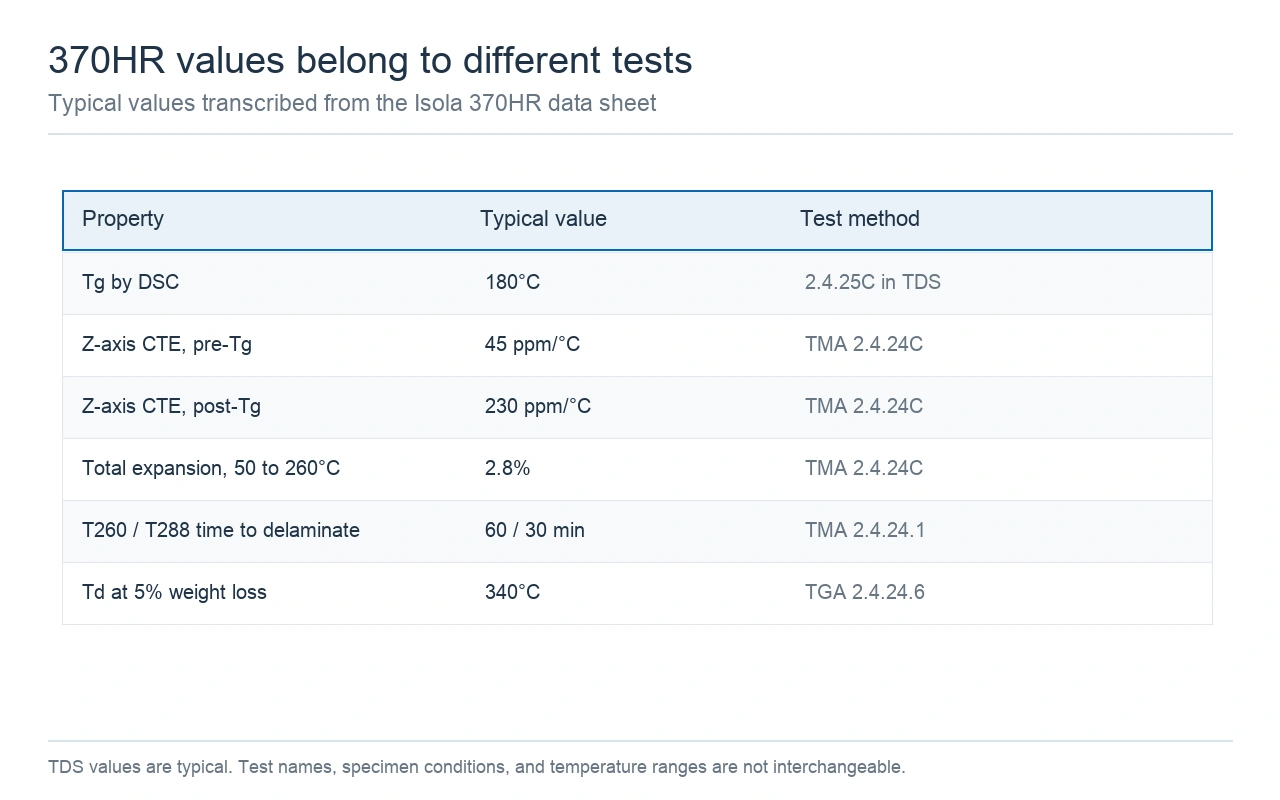
Typical values listed in the 370HR TDS. The tests use different methods and specimen conditions.
A plated through hole is a copper tube through a composite board. The laminate around it contains glass reinforcement and resin. As temperature rises, the laminate's Z-axis movement can differ from the copper barrel's movement. The board constrains the barrel, so the copper can experience tensile and compressive stress as the assembly heats and cools.
The CTE change near Tg makes the temperature path important. A thermal excursion that stays below the transition region can produce a different expansion history from one that crosses it. Repeated cycles can accumulate fatigue damage in a plated barrel, but the amount depends on the hole and pad geometry, laminate construction, copper thickness and quality, thermal profile, and the way the board is supported.
An Isola study of microvias and standard through-hole structures describes separate reliability methods, including thermal shock, interconnect stress testing, and air-to-air thermal cycling, on defined test vehicles. Those methods assess an actual interconnect under stated conditions. A laminate TDS value alone does not reproduce those tests or predict a different board's cycles to failure. Treat the study as evidence that material and via process are variables, not as a lifetime result for an unrelated design.
A manufacturing photograph can provide context for lamination or inspection. It cannot reveal glass style, resin content, the local hole-wall construction, or the result of a thermal cycle. Those facts require material records, drawings, coupons, and the test reports agreed for the project.
 The image shows lamination and inspection context. It does not show a laminate grade or via reliability result.
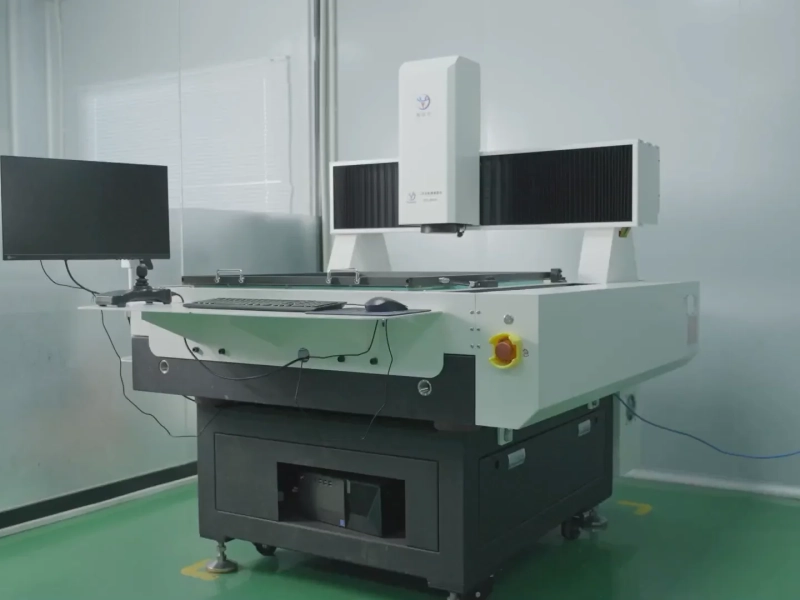
The X-ray target drilling photograph below shows equipment used during hole positioning. It does not show the hole wall, copper thickness, or a reliability test result.
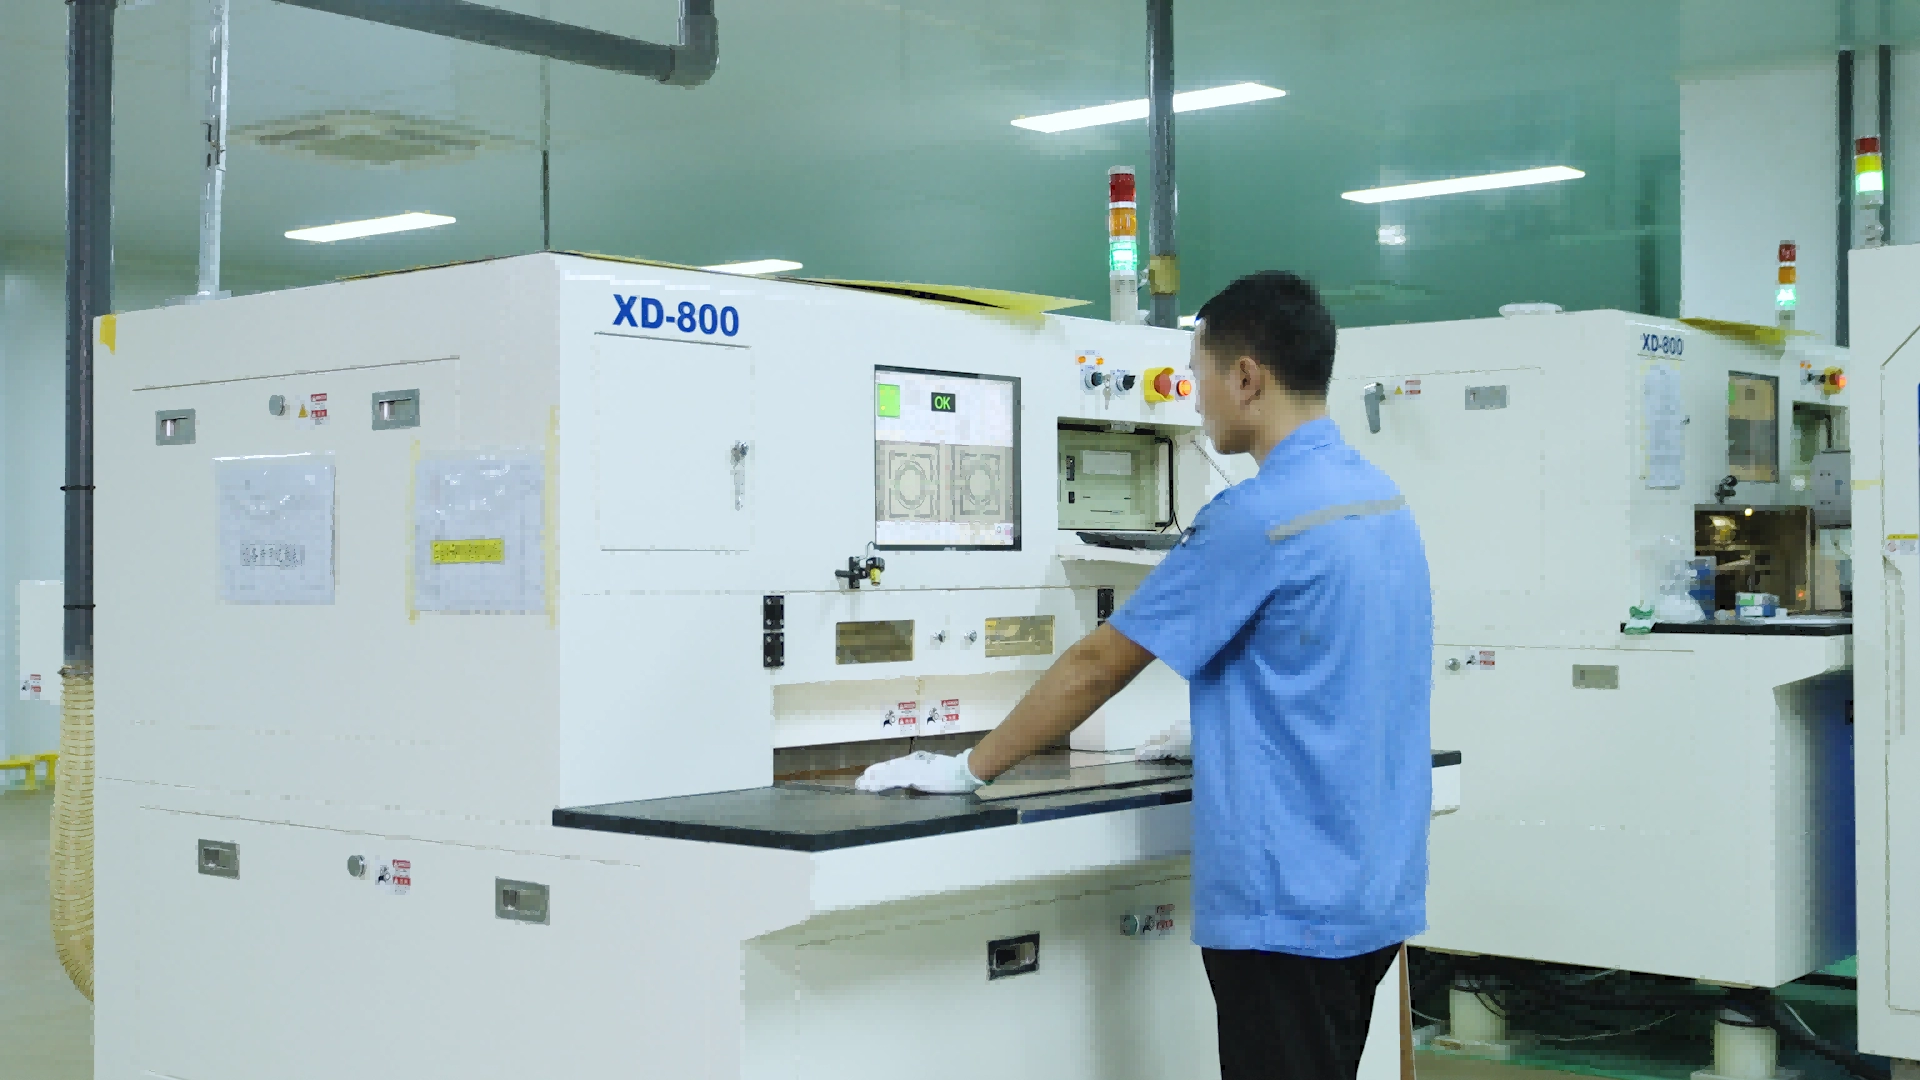
X-ray target drilling equipment provides manufacturing context. The photograph is not a via cross-section or a plating measurement.
The next diagram makes the differential movement idea explicit. It is a concept sketch with no assigned material coefficients or scale. The actual strain field in a multilayer board is affected by copper planes, glass weave, resin-rich areas, hole size, and boundary conditions.
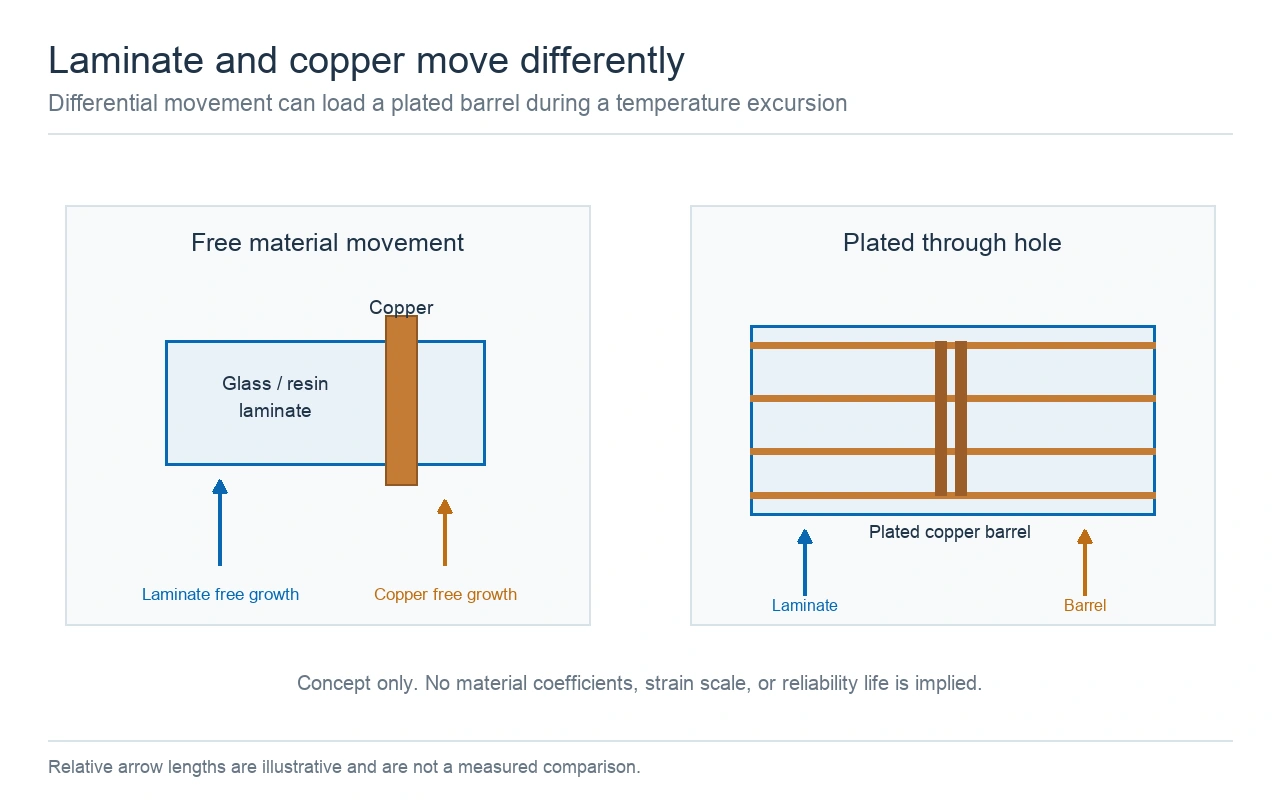 Concept only. Arrow lengths are not to scale and do not represent a measured via strain.
A TDS helps compare laminate options, but its values are not a complete record of a production board. Confirm that the cited grade is the same laminate and prepreg combination used in the drawing. A product family can contain several constructions, glass styles, resin contents, and copper foil options. The chosen stackup determines where those materials sit and how much copper constrains them.
Check the test direction and specimen preparation. A copper-removed TMA specimen differs from a finished board. A single TMA coupon does not have the same local glass and resin distribution as every drilled hole. A TDS value labeled typical should not be used as a guaranteed lot limit unless the material agreement defines it that way.
Keep three temperature questions separate. First, what temperatures does the material test use? Second, what temperature profile does the board see during lamination, soldering, repair, or operation? Third, what reliability test and failure criterion will be used to assess the plated hole? The answers may come from different documents and teams.
For factory review, provide the exact material designation, stackup, board thickness, finished hole diameter, copper plating requirement, and proposed thermal profile. Ask which TMA and reliability records can be supplied for that construction. Do not combine an assumed laminate value with a separate maximum process temperature and call the result a qualified reliability margin.
If the selected laminate changes, compare the whole property set that affects the design. Tg alone does not tell you the expansion from 50 to 260°C. A lower pre-Tg CTE does not guarantee a lower total expansion if the post-Tg behavior or test conditions differ. Keep the material name, method, unit, and temperature range next to every number in the review record.
Worked example 1 uses the two typical 370HR Z-axis coefficients and a simplified transition at the listed DSC Tg of 180°C. From 50 to 180°C, the interval is 130°C. The estimated strain is 45 ppm/°C × 130°C = 5,850 ppm, or 0.585%. From 180 to 260°C, the interval is 80°C. The estimate is 230 ppm/°C × 80°C = 18,400 ppm, or 1.84%. Adding the two intervals gives 2.425%.
That estimate does not equal the 2.8% total expansion listed in the TDS. The difference is 0.375 percentage points. The calculation treats the transition as an abrupt switch at 180°C, although material expansion changes through a transition region. The TDS does not provide the full TMA curve or enough sample detail to reproduce its reported total from the two rounded slopes. Keep the measured 2.8% value and the piecewise 2.425% estimate separate. Do not adjust either coefficient to force agreement.
The table shows the arithmetic and the assumptions. It is useful for a first estimate, but the TMA total remains the reported value for the stated material and test method.
| Interval | CTE used | Temperature span | Estimated expansion |
|---|---|---|---|
| 50 to 180°C | 45 ppm/°C | 130°C | 0.585% |
| 180 to 260°C | 230 ppm/°C | 80°C | 1.840% |
| Piecewise sum | 180°C treated as a sharp boundary | 50 to 260°C | 2.425% |
| TDS reported total | TMA total expansion | 50 to 260°C | 2.8% |
The curve below plots the piecewise estimate and marks the separately reported TDS total. The curve uses the two rounded CTE values, not raw instrument readings.
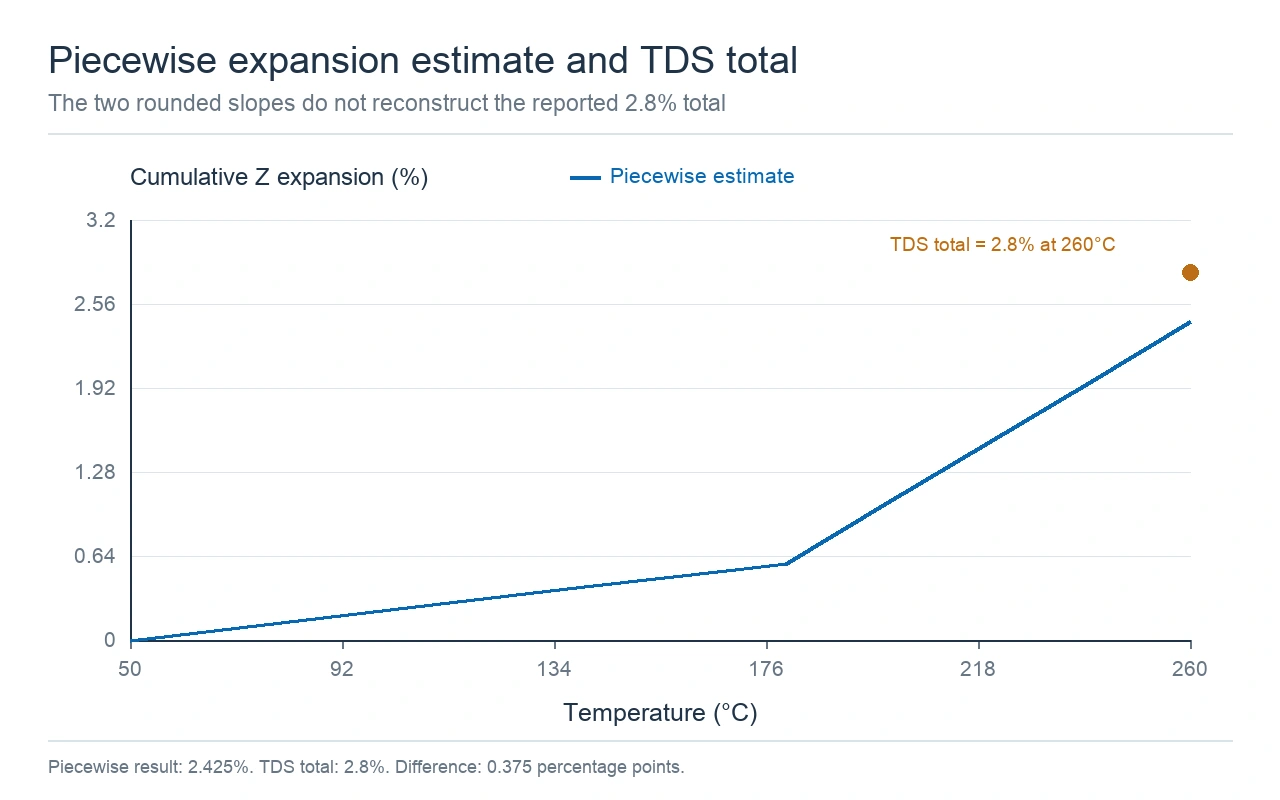
Piecewise estimate is 2.425%. The TDS reports 2.8% total by TMA; the two results are not forced to match.
Worked example 2 scales the TDS total to a notional 1.6 mm thickness. The arithmetic is 1.6 mm × 0.028 = 0.0448 mm, or 44.8 μm. This is the free expansion of a 1.6 mm length under the hypothetical assumption that it follows the listed total expansion uniformly. A real PCB is a copper and glass-resin composite, so this is not a via-barrel strain calculation and it says nothing about cycles to failure.
Thickness scaling makes the assumption visible. The table holds the same 2.8% total expansion constant and varies only the notional starting thickness. It does not turn those values into board inspection limits.
| Notional material thickness | Expansion at 2.8% | Interpretation |
|---|---|---|
| 0.8 mm | 22.4 μm | Free material scaling only |
| 1.6 mm | 44.8 μm | Worked example, not barrel strain |
| 2.4 mm | 67.2 μm | Free material scaling only |
For a multilayer design, give the reviewer the material and construction details behind the calculation. Include the laminate and prepreg names, glass styles, copper weights, board thickness, finished hole diameters, via aspect ratios, and plated copper requirement. Show the temperature profile that prompted the review, including peak, ramp, dwell, and number of excursions.
Separate design inputs from acceptance evidence. A TDS supports material selection. A cross-section or coupon can show a specific plated construction. A thermal-stress or cycling report needs the test method, sample stackup, profile, monitoring method, and failure criterion. Ask for evidence tied to the structure and lot that matter. A generic certificate or a photograph of a board does not answer those questions.
Use the KnownPCB multilayer PCB page to identify the board family, then send the controlled stackup and drill table for review. The quality management page gives the public quality-system context. A manufacturing enquiry should include the exact material designation and the thermal evidence requested for the project. Do not assume that a published product page confirms a particular laminate or via-life limit.
A useful review table has one row per material value and separate columns for source, method, units, range, condition, and intended use. Put the calculated estimate in its own column. If a number has no known test method or specimen condition, label it as an assumption instead of mixing it with measured TDS data.
Z-axis expansion is a starting point for a via reliability discussion. The laminate CTE calculation estimates how much a material length may change under a stated model. The plated barrel responds to the whole composite board, the copper geometry, and the thermal profile. Keep those questions separate until there is test evidence for the actual construction.
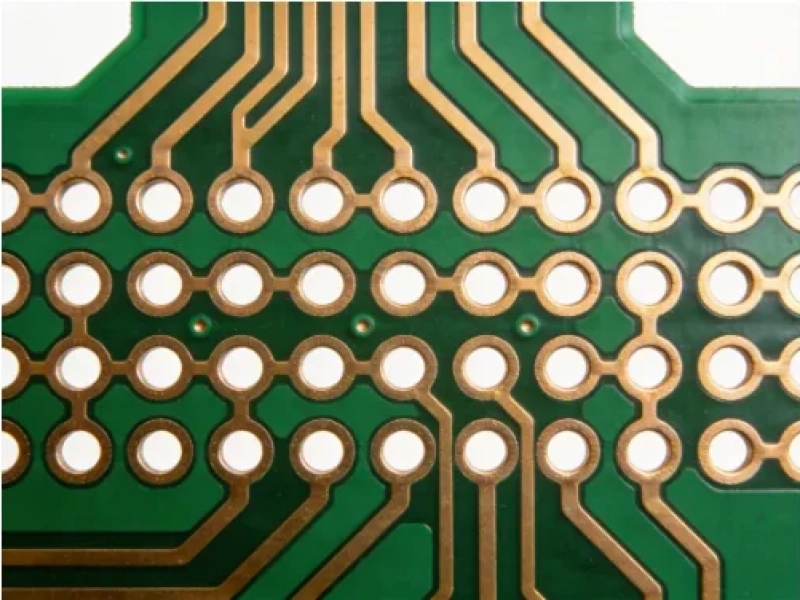
September/24/2026PCB Hole Wall Roughness: Causes, Inspection and Plating Risks
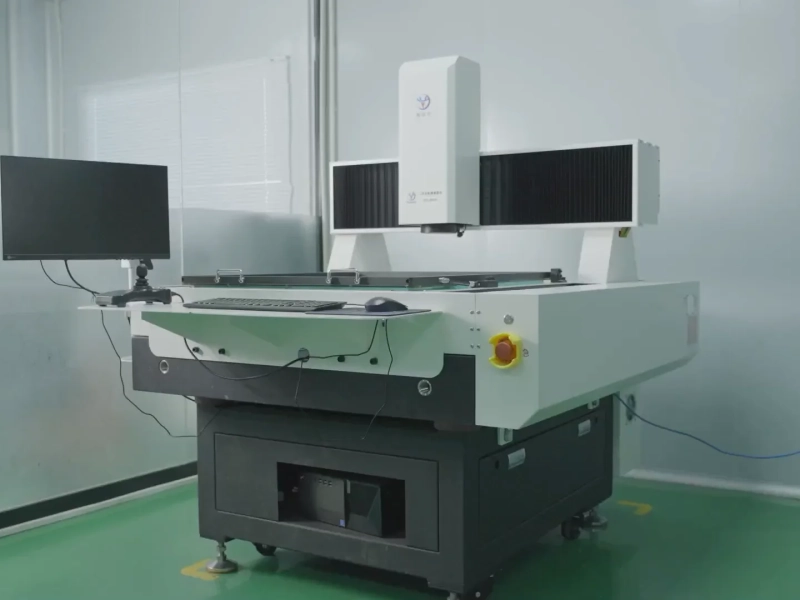
October/22/2026RF PCB Supplier Evaluation: Check the Build Evidence
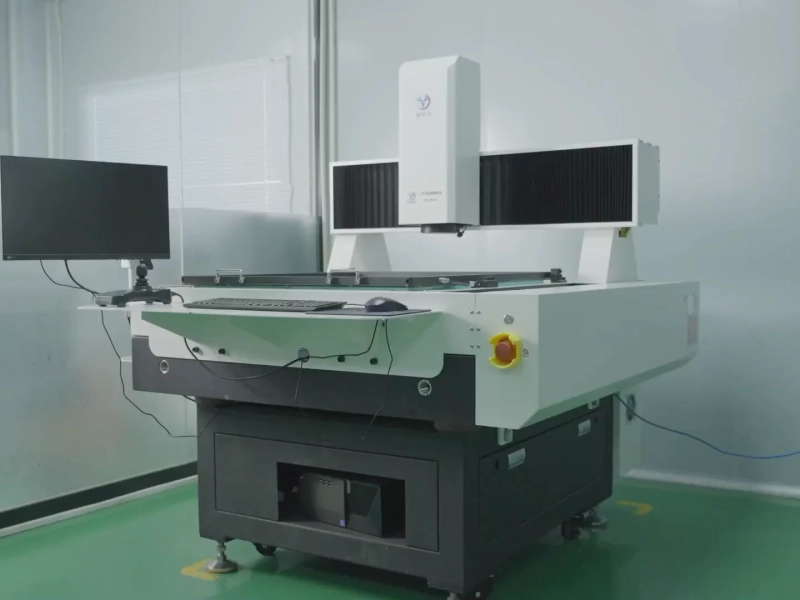
October/06/2026ENEPIG vs ENIG for PCB Pads: Palladium, Inspection and Finish Choice
April/09/2026Heavy Copper PCB Projects
September/28/2026PCB Annular Ring Breakout: Causes, Layer Inspection, and DFM Checks